Facebook Revenues details for the quarter were released yesterday and they have again repeated their stellar performance riding on the back of great advertising revenues.
No wonder that Facebook is increasingly becoming a platform of choice for personal and professional use. Brands are increasing finding the platform very conducive for marketing which is evident from the numbers.
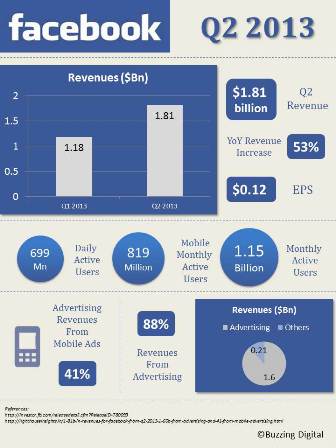
Last quarter, Facebook revenues stood at $1.81 billion against $1.18 billion in the previous quarter. It’s revenues rose by over 53% from the same quarter in the previous year.
Facebook Revenues Stats
1. $1.6 billion of the Facebook Revenues is being contributed by Facebook Ads
2. 41% of the advertising revenues is coming from Mobile advertising
3. An average of 699 million daily active users
4. Nearly 819 million mobile monthly active users
5. Has over 1 million active advertisers
6. Operating margins stood at 31% over negative 63% in the last quarter
7. Facebook for Every Phone has over 100 million active users
8. Has launched verified pages, hashtags and embedded posts over the last quarter
The following infographic captures some of the interesting numbers to showcase Facebook’s performance over the last quarter.
What you can do now?
1. What do you make out of the Advertising revenues? Are they over-leveraged on advertising?
2. What other areas should Facebook focus to increase their revenues?
Do share your thoughts about Facebook revenues and this infographic.